Introduction to social network analysis in R and Gephi

This chapter is an introductory tutorial to the broad field of social network analysis. The tutorial includes an example of how to use social network analysis to detect communities in online debates on social platforms like X (Twitter). In the given example you’ll learn how to assess a sample of X (Twitter) users retweeting messages using #Vaccination during the Covid-19 pandemic. During the Covid-19 pandemic #Vaccination was also used by accounts that amplified conspiracy narratives and health misinformation about vaccines. The network analysis approach illustrates how to identify communities of users that are more likely to amplify dis- and/or misinformation by combining community-detection algorithms with qualitative content analysis of identified communities.
The chapter is structured as follows:
- Where to start: An Introduction to Social Network Analysis
- Analyzing X (Twitter) networks in R
- Analyzing X (Twitter) networks in Python
- Analyzing and visualizing networks in Gephi
- Learning from research examples
Where to start: An introduction to Social Network Analysis
Social network analysis (SNA) is a method used to study and better understand the relationships and interactions among individuals, groups, or entities. In social network analysis, you represent these relationships as a network, where each individual or entity is a node, and the connections between them are represented as edges. Depending on the terminology sometimes nodes are also called vertices.
SNA can help you uncover valuable insights about how information, resources, and influence flow within networked systems. It allows you to analyze patterns, identify key individuals or groups, and understand the overall structure and dynamics of a social network.
Early examples from sociology for instance, identified patterns of the spread of sexual diseases at high schools. Today in a digitalized world, human behavior leaves traces in many ways whether we write messages to someone on X (Twitter) or WhatsApp or walk through the city with our mobile phone. This certainly raises privacy concerns that are addressed by data protection regulations like the European Union’s GDPR. Privacy concerns and further ethical consideration need to be considered during all steps of a research project; when designing the methodological approach, during data collection and analysis as well as during the writing and publication process. Now, let’s consider a few examples of how social network analysis can be applied on real-world data:
- Online Social Networks: Imagine you have data from a social media platform like Facebook or X (Twitter). You can use social network analysis in R to study patterns of communication, identify influential users, detect communities, and understand information diffusion. For instance, you can analyze how ideas or trends spread across a network of X (Twitter) users.
- Collaboration Networks: In academic or professional settings, social network analysis can be used to study collaboration patterns among researchers, employees, or organizations. For instance, each mention of another research creates a link to the author and the referenced article (or the article URL). By analyzing co-authorship networks or co-worker networks, you can identify key players, measure the impact of collaborations, and uncover potential research or business opportunities.
- Organizational Networks: Social network analysis can also be applied to understand the structure and dynamics of organizations. By examining communication networks within a company, you can identify bottlenecks, assess information flow, and evaluate the effectiveness of teams or departments. This analysis can help organizations optimize their structure and improve collaboration. This, however, comes with high ethical and privacy concerns, and you should ensure that your research is covered by employment or data protection laws.
In this tutorial, you will primarily learn about community detection on X (Twitter), how to analyze its networked structure, detect community structures based on users’ communication behavior. Some measures and terms that you will hear frequently and help to assess and understand network structures are the following:
-
Degree Centrality: The degree of a node is the number of other nodes that a node is connected to. Important nodes tend to have more connections to other nodes. Highly connected nodes are interpreted to have high degree centrality. In the later case of X (Twitter) “retweet networks” a high degree of incoming edges (indegree) represents being retweeted frequently and can be used to identify influential accounts in the given debate. The number of outgoing edges (outdegree) represents the number of times a given account or user retweeted other accounts. Regarding, retweet behavior, this may indicate partisan support or if the number is very high potentially inauthentic behavior of an account (e.g. through bots).
-
Eigenvector Centrality: The extent to which adjacent nodes are connected also indicate importance (out differently: important nodes increase the importance of other nodes). This measure basically assesses how connected a node is on higher degrees of connection such as second and third-degree connections.
-
Closeness centrality: Closeness centrality measures how many steps are required to access every other node from a given node. In other words, nodes with a high closeness centrality have easy access to other nodes given multiple connections.
-
Betweenness Centrality: The betweenness centrality measure ranks the nodes based on the flow of connections through the network. Importance is demonstrated through high frequency of connection with multiple other nodes. Nodes with high levels of betweenness tend to serve as a bridge for multiple sets of other important nodes.
-
Modularity: Modularity is a measure of the structure of networks which measures the strength of segments of a network into communities (also called groups, clusters or modules). Networks with high modularity have relatively densely connected components, that means there are dense connections between the nodes within communities but sparse connections between nodes in different communities (Newman 2006). Modularity is often used in optimization methods for detecting community structure in networks such as the Louvain algorithm (Blondel et al. 2008).
Getting started with social network analysis
Your setup
To perform social network analysis in R or Python, you can use packages and libraries like igraph, network, and sna. These packages provide functions to import network data, create network objects, visualize networks, and analyze network properties such as centrality measures (e.g., degree, betweenness) or community detection. By applying these techniques, you can gain sometimes mesmerizing insights into the social relationships and interactions that shape our lives and communities. Social network analysis in R allows you to explore, visualize, and understand complex social networks, ultimately helping you make informed decisions, improve social systems and in this tutorial’s example better understand large-scale political discourses online and the potential amplification fo false information.
Recommended reading
Remember, social network analysis is a vast field with numerous advanced methods and techniques. So, if you find it intriguing, there is a lot more to explore and learn! As introductory books I would recommend Carrington et al. (2005), Scott (2017) or Yang (2016). Other scholars and online researchers have also created tutorials introducing network analysis and its application based on a variety of tools from programming and data analysis software like R and Python to open-source OSINT tools like Gephi.
Parameters of example case
The following tutorial is based on X (Twitter) data that was accessible for researchers via X’s (Twitter’s) Academic API until February 2023 when Elon Musk and Twitter closed the free Research API access to X’s (Twitter) data. The data used for this tutorial was collected using an R package called AcademicTwitter developed by colleagues from the research community.
Considering the implementation of the EU Digital Services Act, we can expect extended research data access for so-called vetted researchers at the latest by September 2024. Moreover, there should be APIs with limited research data access for a broad research community. Here you can find a policy brief arguing for the importance of research data access for policymaking and better understanding social implications of digital online platforms and search engines (https://opus4.kobv.de/opus4-hsog/frontdoor/deliver/index/docId/4947/file/Implementing_Data_Access_Darius_Stockmann_2023.pdf).
Step-by-Step tutorial on X (Twitter) networks in R
But now let’s get started creating and analyzing our first X (Twitter) networks!
As selection criteria for your data collection, it is possible to filter for key words, hashtags or collect the timelines (messages shared) by users via user lists. This is mostly used for political elites like politicians, new network elites like political influencers or profiles of media outlets (whatever type of accounts you are interested in).
To illustrate this work, this tutorial replicated the work from Darius and Urquhart (2021), in which we collected data by choosing hashtags as selection criteria. When interested in information diffusion, the spread of information and messages on social networking sites like X (Twitter), retweeting is the most often used mechanism to amplify or share messages by other users. Retweeting also creates a link (edge) between two accounts (nodes), constituting a retweet network. These retweet networks often cluster into multiple communities, and for political hashtags, these communities represent different ideologies or opinions on a topic (Conover et al., 2012).
Thus, retweet networks provide the chance to assess ideological alignment and opinion leaders/influencers within communities where people self-sort via their retweeting behavior (Conover et al., 2012; Bruns et al., 2016). This self-sorting into different aligned communities happens because most users retweet in support of messages (Boyd et al., 2010; Metaxas et al., 2015). Moreover, users adopt retweets quicker than using hashtags in individual tweets (Oliveira et al., 2021). Thus, the analysis focuses on the retweet network of the vaccination hashtag. The following tutorial is based on X (Twitter) data collected during the Covid-19 pandemic and focuses on accounts that retweeted or posted messages using #vaccines during the observation period. Social network analysis enables the visualization and identification of communities. Thereafter, a qualitative inspection of most shared content in each community enables the identification of those that amplify disinformation or conspiracy narratives as a specific form of disinformation. In this tutorial, however, the qualitative inspection is limited because X’s (Twitter) data protection guidelines prohibit the sharing of screennames, and a lot of the accounts have been deleted. Thus, the data only includes pseudo-identifiers, and you may be better served by replicating the analysis and network creation with your self-collected data or research data from archives.
Tutorial on Social Network Analysis of Twitter Networks in R
R is a free software environment for statistical computing and graphics that is used by researchers from a variety of disciplines. It compiles and runs on a wide variety of UNIX platforms, Windows and MacOS. You can download the software here and can find a step-by-step tutorial on installing R and R Studio here.
In this case you will use R to create and analyze a network data edge list from X (Twitter) data.
First Tab:
d <- df_vaccines

# create variable d$isRetweet
d$RT <- gsub("([A-Za-z]+).*", "\\1", d$text)
d$isRetweet <- ifelse(d$RT == "RT", TRUE, FALSE)

# Split into retweets and original tweets
sp = split(d, d$isRetweet)
orig = sp[['FALSE']]

# Extract the retweets and pull the original author's screenname
rt = mutate(sp[['TRUE']], sender = substr(text, 5, regexpr(':', text) - 1))

# Adjust retweets to create an edgelist for network
el = as.data.frame(cbind(sender = tolower(rt$sender),
                         receiver = tolower(rt$author_id)))
class(el$sender)
class(el$receiver)

el = count(el, sender, receiver)

# create duplicate from edgelist
df_el <- el

# rename columns for import into Gephi (Gephi requires a "Source" and "Target" column in order to read edgelists of directed networks)
names(df_el)[1] <- "Target"
names(df_el)[2] <- "Source"
df_el$Weight <- df_el$n

# save the edgelist in csv-format (comma-spearated values) for easy import to Gephi
write.csv(df_el, file = "Vaccines_retweet_network.csv", row.names = FALSE)
Now you can 1) continue the analysis in R OR 2) import the edgelist into the open-source software Gephi to visualize and further analyze the network.
The most frequently used packages for network analysis in R are network (https://cran.r-project.org/web/packages/network/index.html), igraph (https://cran.r-project.org/web/packages/igraph/index.html), and sna (https://cran.r-project.org/web/packages/sna/index.html).
Start by loading your edgelist to R:
# install packages
install.packages('twitteR', 'dplyr', 'ggplot2', 'lubridate', 'network', 'sna', 'igraph', 'network', 'qdap', 'tm')
install.packages("remotes")
remotes::install_github("analyxcompany/ForceAtlas2")

# Once installed, load the packages using the library() function:
library(igraph)
library(network)
library(sna)
library(dplyr)
library(utils)
library(ForceAtlas2)

"Step 2: Importing network data Next, you'll need to import your network data into R. The format of your data will depend on the specific network analysis you want to perform. For example, if you have an edge list (a list of connections between nodes), you can
import it using the read.table() function:"

# Importing edge list (will be from a GitHub Page; GDrive or Dropbox)
edge_list <- read_csv("~/Documents/Hertie/Freelance/Bertelsmann Stiftung/Knowledge Hub/Bertelsmann Knowledge Hub_SNA Tutorial_Darius/Vaccine_edgelist_rtnet.csv")

edge_list <- Vaccine_edgelist_rtnet

# make sure there are no NAs in your edgelist
edge_list <- na.omit(edge_list)

# write_csv(edge_list, "Vaccine_edgelist_rtnet.csv")

"If you have data in a different format, you may need to use a different function to import it.
Step 3: Creating a network object once you have imported your network data, you need to create a network object that R can work with. The specific function you use will depends on the package you are using."

# Create an igraph network object
network_igraph <- graph_from_data_frame(d = edge_list, directed = TRUE)

# If you are using the network package, you can create a network object from the edge list using the network() function:
rtnet <- network(edge_list, directed = TRUE, loops = TRUE, multiple = TRUE)


# Step 4: Basic network visualization To visualize the network, you can use the plot() function from the igraph package:

# Visualize the network
plot(rtnet, remove.multiple = F, remove.loops = T, edge.arrow.size=.4,vertex.label=NA, vertex.size2 = 0.1)

plot(network_igraph, remove.multiple = F, remove.loops = T, edge.arrow.size=.4,vertex.label=NA, vertex.size2 = 0.1)
  # this shows only a 'ball' if nodes but we can see already a clustered structure

# Large Graph Layout
layout_with_lgl(network_igraph)

# try ForceAtlas2 layout algorithm (this is computationally expansive an will take some time due to the size of the network)
layout <- layout.forceatlas2(network_igraph, iterations=3000, plotstep=100)
plot(network_igraph, layout=layout)

"Step 5: Analyzing network properties Now that you have your network object, you can analyze
various network properties. Here we focus on degree centrality and betweenness centrality:

Degree centrality: The degree centrality of a node is the number of connections it so the number of edges adjacent to it. In case of directed networks, we can also define in-degree (the number of edges pointing towards the node/vertex) and out-degree (the number of edges originating from the node/vertex)."

# Network measures with Igraph (alternatively you can also calculate them with other network analysis packages for R like "network", here we are using IGraph)

degree(network_igraph)

# Betweenness centrality: The betweenness centrality of a node measures the extent to which it lies on the shortest paths between other nodes. You can calculate the betweenness centrality using the betweenness() function:
edge_betweenness(network_igraph)

# the network package also allows for easy estimation of further centrality measures such as eigenvector centrality or closeness centrality (see 6.7 Centrality & Centralization in https://kateto.net/netscix2016.html)
If you are new to network analysis, you may want to start by exploring the network graph in Gehpi and then turning to further analysis in R or Python. Gephi works well with large network data sets and produces extremely good-looking graphs providing color palettes, and a variety of layout algorithms and network measures.
Tutorial on Social Network Analysis of Twitter Networks in Python
This is a short introduction on social network analysis in Python. Python is a high-level, general-purpose programming language used by many researchers and data scientists. In this example you run the script in Google Colab but you can also run the script in Jupyter Notebooks or an integrated development environment (IDE) of your choice.
# Intro2SNA - Analysing Social Networks with Python

# Step 1: Install and load the igraph package First, make sure you have the igraph package installed. Run the following code to install it:
!pip install python-igraph
!pip install pandas
!pip install pycairo
!pip install cairocffi

# Then, load the package using the import statement:
import igraph as ig

# Step 2: Import the edgelist data Assuming you have an edgelist CSV file with columns 'source' and 'target' representing retweet connections, you can import it using the read() function from the pandas library:
import pandas as pd

# mount Drive (if in Colabs or load from local disk or GitHub)
from google.colab import drive
drive.mount('/content/drive')

# Import the edgelist data
edgelist = pd.read_csv('/content/drive/MyDrive/Vaccine_edgelist_rtnet.csv')


# Step 3: Create a network object Next, create a network object using igraph's Graph() function. You can pass the source and target columns from the edgelist DataFrame as arguments:
# Create a graph from the edgelist data
network = ig.Graph.TupleList(edgelist.itertuples(index=False), directed=True)

# Step 4: Basic network visualization To visualize the network, use the plot() function:
ig.plot(network, bbox=(2000, 2000))
# This will generate a basic plot of the retweet network.

# Step 5: Analyzing network properties Now, you can analyze various network properties using igraph. Here are a few examples:

# Degree centrality: Calculate the in-degree centrality (number of retweets received) using the indegree() function:
indegree_centrality = network.indegree()
print(indegree_centrality)
#plt.plot(indegree_centrality)


# Betweenness centrality: Calculate the betweenness centrality using the betweenness() function:
betweenness_centrality = network.betweenness()
print(betweenness_centrality)

# Community detection: Detect communities within the network using edge-betweenness for directed graphs:
community_EB = network.community_edge_betweenness()

print(community_EB)


# Igraph and other packages provide many more community detection algorithms that you can compare https://igraph.org/python/doc/api/igraph.Graph.html#community_multilevel

# Step 6: To visualize network properties, you can use different plotting functions. Here are a few examples:

# Visualizing in-degree centrality
ig.plot(network, vertex_size=indegree_centrality, bbox=(4000, 4000))

# Visualizing betweenness centrality:
ig.plot(network, vertex_size=betweenness_centrality, bbox=(4000, 4000))

# As we can see the network graphs look rather messy but by adjusting the layout, node size and gravity we can make them look nicer. In Gephi, however, the visualization of large networks is much more straight-forward.
You can find more extensive tutorials for further investigation of networks in Python on YouTube, GitHub or by searching the Web. These are well done examples:
- Network Analysis and Community Detection on Political Tweets by Kristina Popova on Medium
- IGraph Tutorial
- Networkx Tutorial
Implementing Social Network Analysis of X (Twitter) Networks in Gephi
Gephi is an open-source software tool for (social) network analysis and alllows for great-looking visualizations, even of large-scale networks. You can download Gephi for free here.
Now import our edgelist file Vaccine_edgelist_rtnet.csv in Gephi as a spreadsheet: File > Import spreadsheet” and select “Separator = Comma” (because we are importing a comma-separated values file), “Import as: Edges table” and “Charset = UTF-8”, which should be the default anyway. In the second import step you need to select a time representation, which is irrelevant in this case but matters if you are importing dynamic network data that inspects changes over time. You can select “Time representation = Intervals” and press “Finish”.
Now the import report window should open and show you 4593 nodes and 8554 edges that were correctly read (you canignore all values with missing source or target nodes IDs). Choose “Graph Type = Directed”, because retweeting someone has a direction and we are interested in who was most retweeted by others and who most frequently retweeted others to detect patterns in accounts’ behavior. Select “New workspace”, press “More options…” and “Edges merge strategy = SUM”, then press “OK” at the bottom right corner.
Now the imported network data appears as a black square on your Gephi window (see Screenshot 1 below).
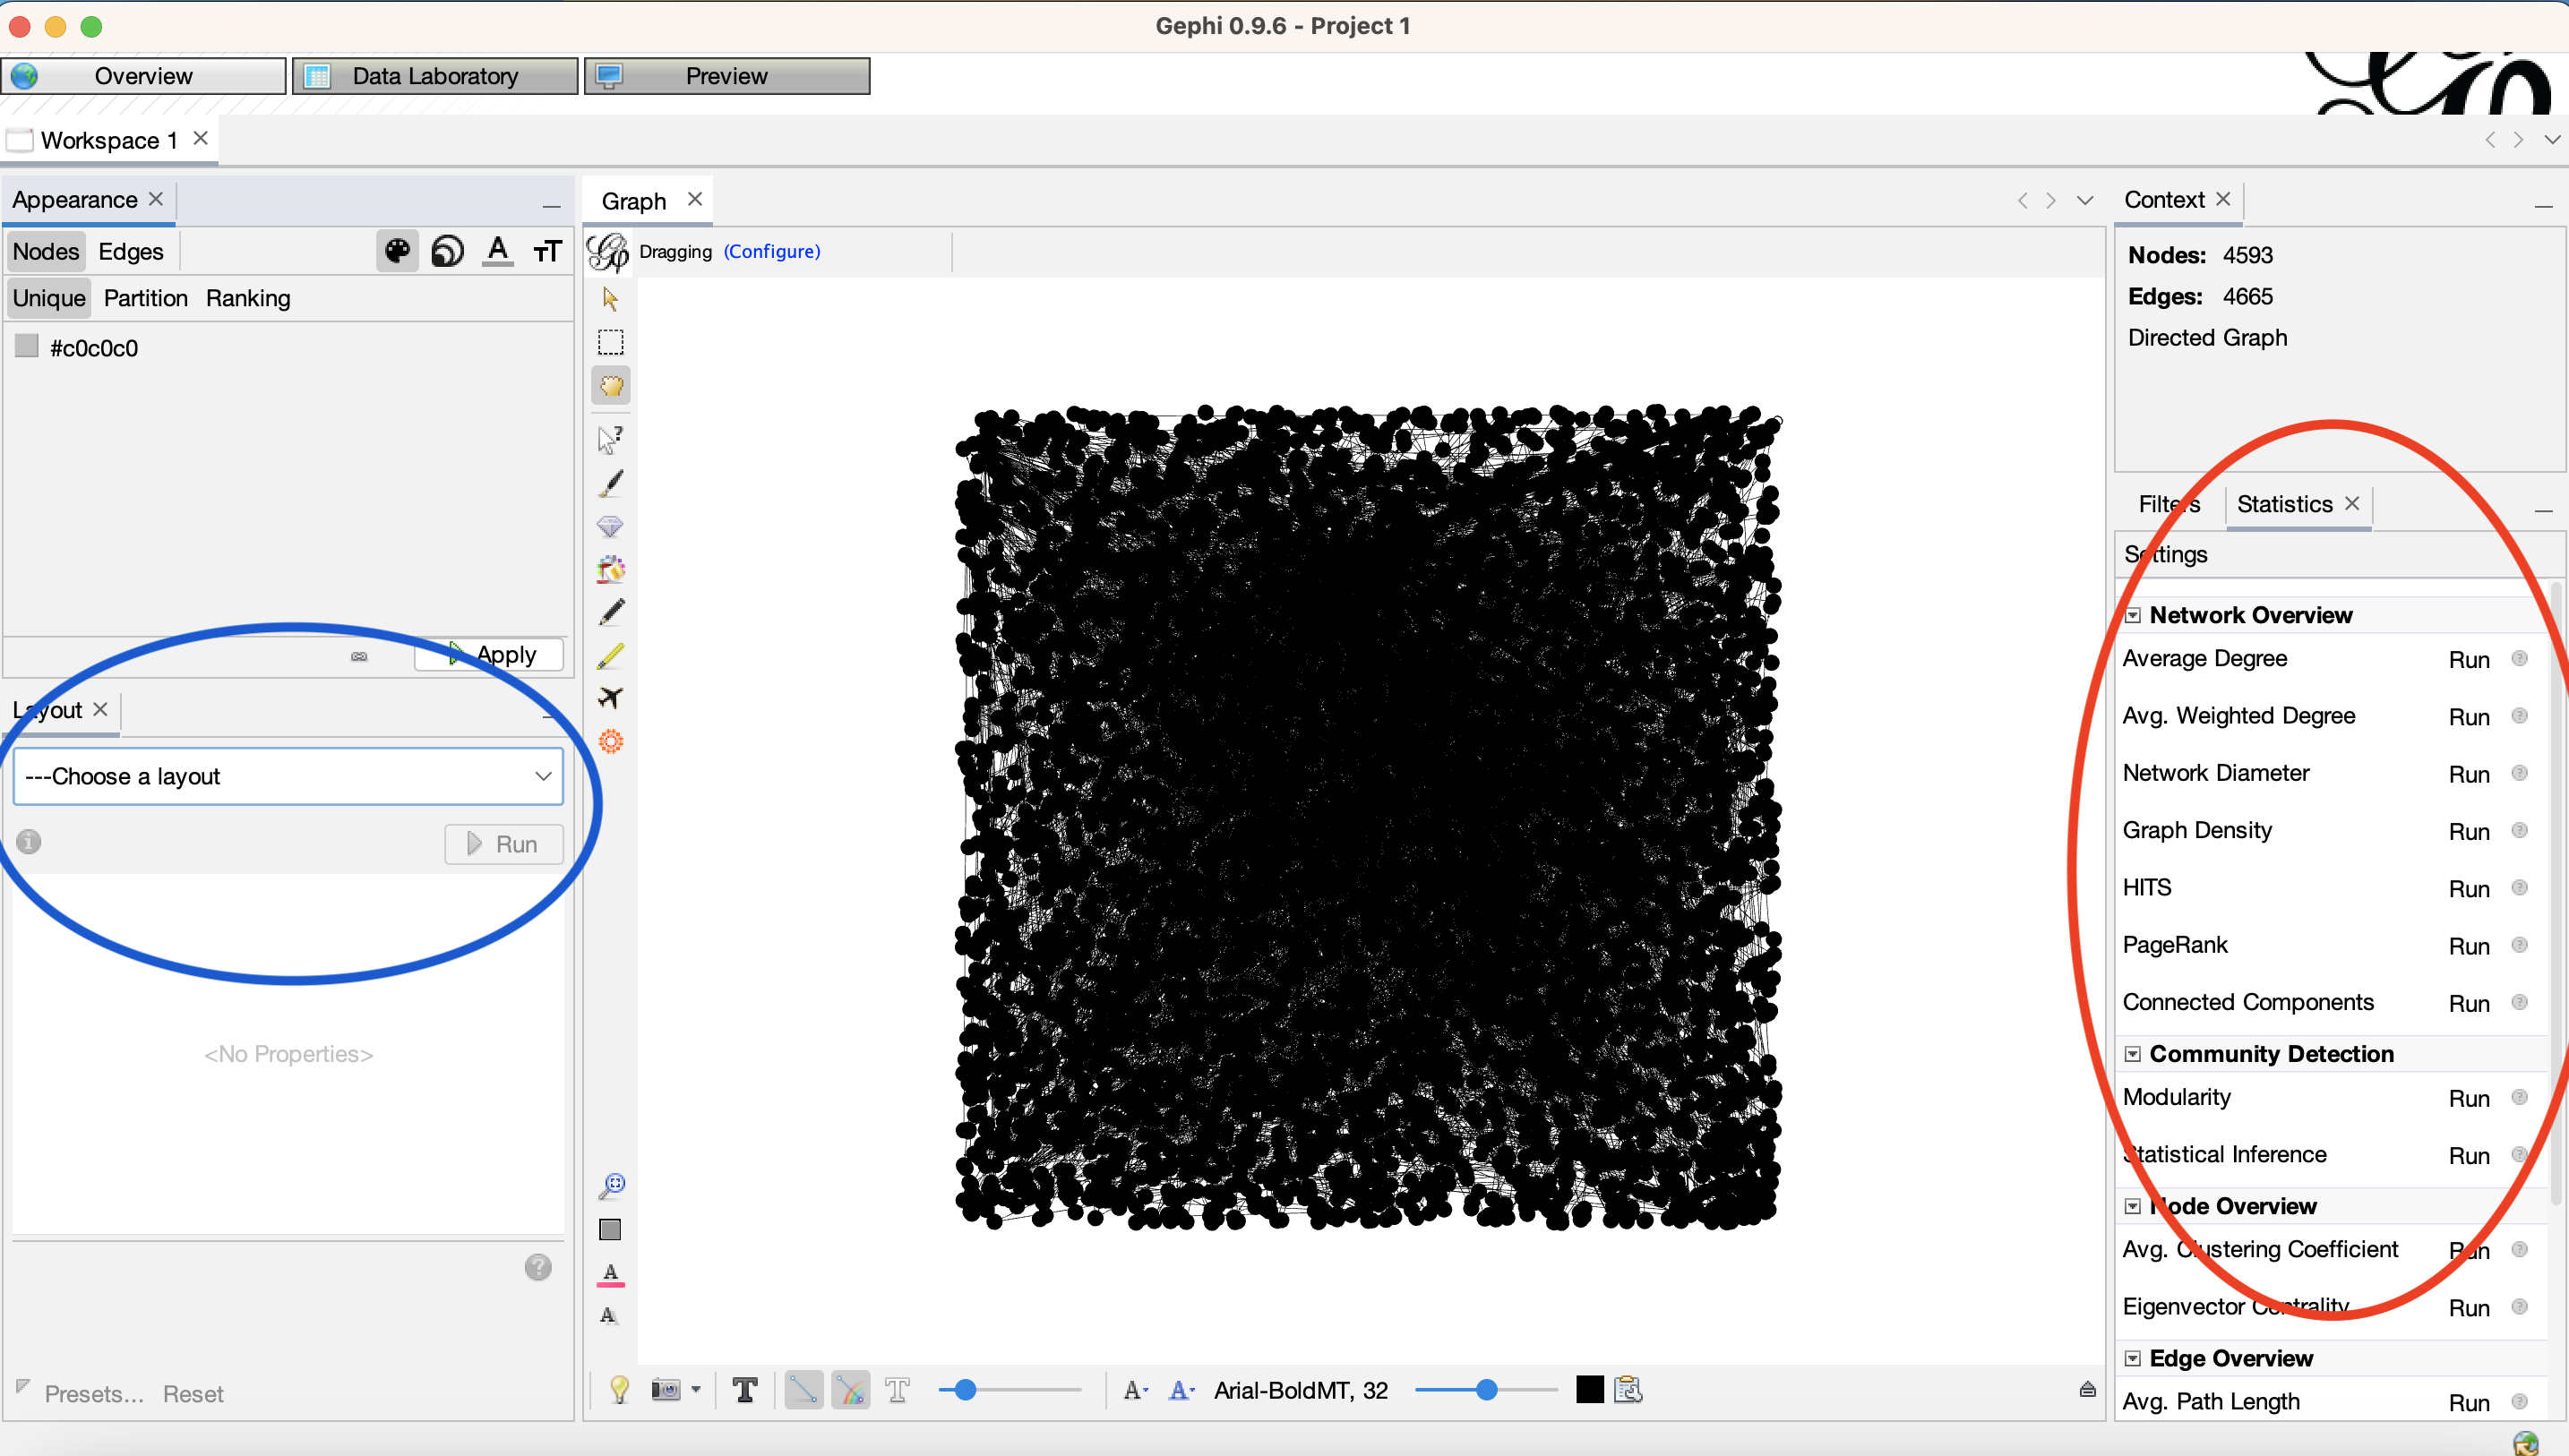
On the right-hand side (red circle) of the Gephi interface you can run analyses by pressing the “Run” button. For this tutorial press “RUN” for “Average Degree”, “Avg. Weighted Degree” and “Modularity” as a community detection method based on the Louvain algorithm. In the Box that opens click “Randomize” and “Use Weights”, then choose “Resolution: 5.0”. Increasing the resolution parameter, based on Lambiotte et al. (2009), results in less-fractioned communities, if they seem too large for you, you can re-run the modularity algorithm with a lower resolution parameter.
On the left-hand side (blue circle) of the Gephi interface, you can choose a layout algorithm to visualize the network. Select ForceAtlas2 and press “Run” with the default parameters. Now the black square starts to disintegrate as the layout algorithms force unconnected nodes to repel each other. Let the network expand until it appears to not change anymore and converge.
Now you can already see several distinct clusters where nodes are more densely connected with each other than with nodes in other clusters. The next step assigns a color to network nodes based on the modularity groups that were identified with the Louvain algorithm.
In screenshot 2 the green circle indicates where to select “Partition” by “Modularity Class” in the top left corner to assign modularity class color to nodes in the network. You can change the colors by clicking on the color squares and choosing from a color palette for each community or choose a pre-saved palette by clicking on “Palette” in the bottom right corner. Choose colors or a palette with sufficient contrast to the background to help with accessibility.
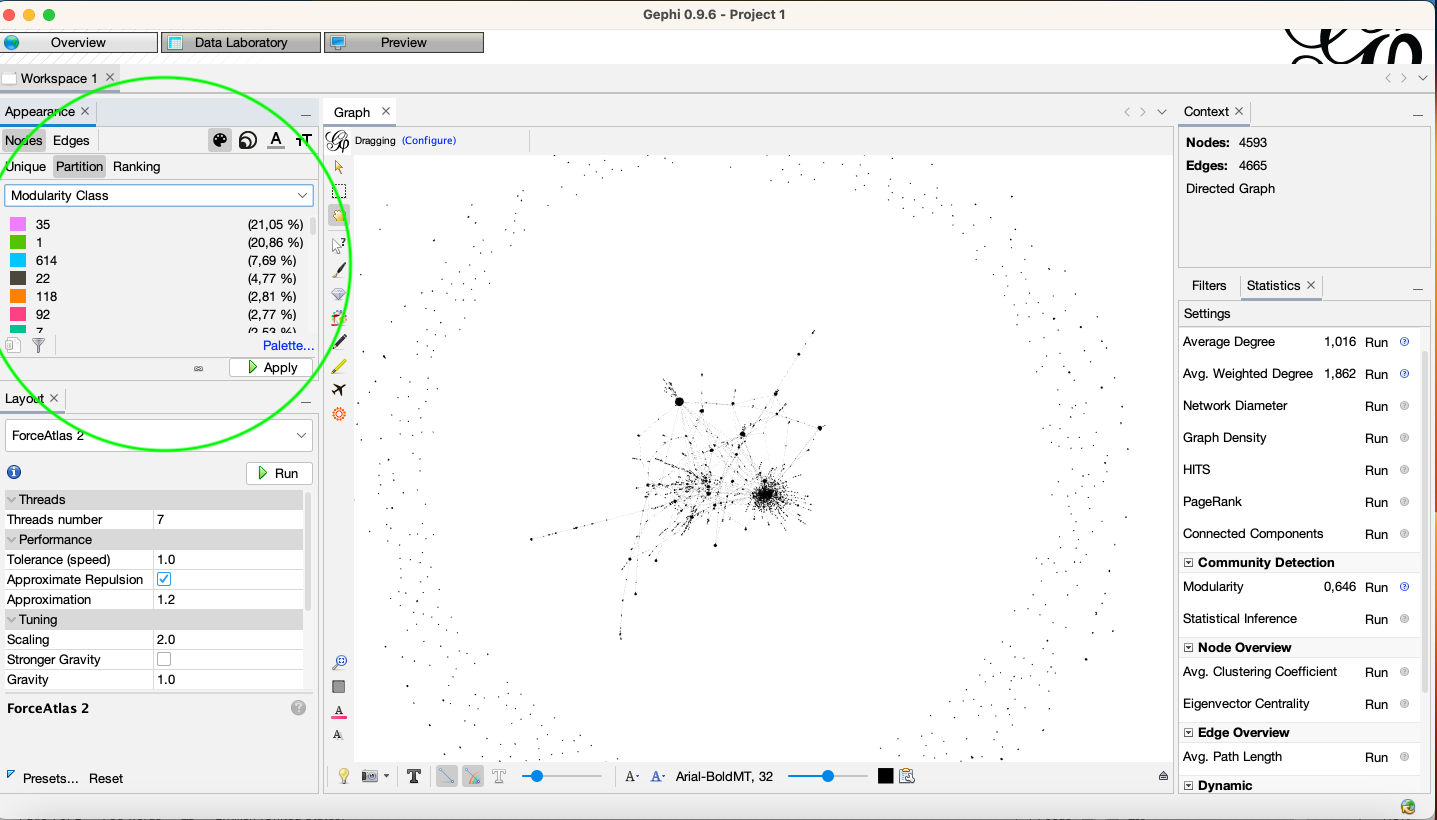
After applying the modularity class-based coloring you can see that that community membership largely collides with the network clusters. Now you use qualitative content analysis on a sample of accounts or the most retweeted account (those with the highest indegree) to get an idea of the sort of content that is shared in each of the identified communities. To do so, click on the top bar on “Data Laboratory” and sort for weighted indegree, which is the sum of times an account was retweeted. Now you can inspect the accounts that were most retweeted, their position in the network graph and look them up on X (Twitter). For this tutorial we have dehydrated or anonymized for privacy protection and to comply with X’s (Twitter’s) data sharing regulations. Within your self-collected data, you can look up accounts via usernames or X (Twitter)-IDs.
The following video briefly illustrates the steps of analysis in Gephi:
On YouTube and other platforms there are many more great Gephi video tutorials. For instance, I would recommend Martin Grandjean's tutorial for the start, which you can find here.
Research Example
In Darius and Urquhart (2021) we inspect the emergence and growth of conspiracy communities on UK Twitter during the Covid-19 pandemic using social network analyis and qualitative content analysis with which we identify those communities and accounts that issue and share messages aligned with conspiracy narratives about vaccination (e.g. that vaccinations implant micro-chips to control the population). In general the detection of communities with community detection algrorithms should be accompanied with automated text analysis or qualitative analysis of content circulated in the identified communities. In the study we identified a high presence of tweets referencing conspiracy narratives and noted an overproportional growth of conspiracy communities. The following figure from Darius and Urquhart (2021) illustraes the anti-vaccination community before and after the introduction of so-called lockdown policies to reduce the spread of Covid-19. The graph illustrate that the anti-vaccination movement constitues about a third of retweets with regard to the #Vaccination during the later observation period.

This resonated with studies by others, that identifed a growing presence of conspiracy narratives about vaccinations but also with respect to 5G during the Covid19 pandemic (Ahmed et al., 2020; Yang et al., 2021). You can find a lot of interdisciplinary research using network approaches in the journals “Social Networks”, “Online Social Networks and Mining”, or “Online Social Networks and Media”. Have fun exploring the world of social and complex networks!
References
Ahmed, Wasim, Josep Vidal-Alaball, Joseph Downing, and Francesc López Seguí. “COVID-19 and the 5G Conspiracy Theory: Social Network Analysis of Twitter Data.” Journal of Medical Internet Research 22, no. 5 (May 6, 2020): e19458. https://doi.org/10.2196/19458.
Blondel, Vincent D., Jean-Loup Guillaume, Renaud Lambiotte, and Etienne Lefebvre. “Fast Unfolding of Communities in Large Networks.” Journal of Statistical Mechanics: Theory and Experiment 2008, no. 10 (October 9, 2008): P10008. https://doi.org/10.1088/1742-5468/2008/10/P10008.
Boyd, Danah, Scott Golder, and Gilad Lotan. “Tweet, Tweet, Retweet: Conversational Aspects of Retweeting on Twitter.” In 2010 43rd Hawaii International Conference on System Sciences, 1–10, 2010. https://doi.org/10.1109/HICSS.2010.412.
Bruns, Axel, Brenda Moon, Avijit Paul, and Felix Münch. “Towards a Typology of Hashtag Publics: A Large-Scale Comparative Study of User Engagement across Trending Topics.” Communication Research and Practice 2, no. 1 (January 2, 2016): 20–46. https://doi.org/10.1080/22041451.2016.1155328.
Caplan, Robyn, and Danah Boyd. “Who Controls the Public Sphere in an Era of Algorithms.” Mediation, Automation, Power, 2016, 1–19.
Carrington, Peter J., John Scott, and Stanley Wasserman. Models and Methods in Social Network Analysis. Vol. 28. Cambridge university press, 2005.
Conover, Michael D., Bruno Gonçalves, Alessandro Flammini, and Filippo Menczer. “Partisan Asymmetries in Online Political Activity.” EPJ Data Science 1, no. 1 (December 2012): 1–19. https://doi.org/10.1140/epjds6.
Darius, Philipp, and Michael Urquhart. “Disinformed Social Movements: A Large-Scale Mapping of Conspiracy Narratives as Online Harms during the COVID-19 Pandemic.” Online Social Networks and Media 26 (November 2021): 100174. https://doi.org/10.1016/j.osnem.2021.100174.
Gaisbauer, Felix, Armin Pournaki, Sven Banisch, and Eckehard Olbrich. “Grounding Force-Directed Network Layouts with Latent Space Models.” Journal of Computational Social Science, May 29, 2023. https://doi.org/10.1007/s42001-023-00207-w.
Lambiotte, R., J.-C. Delvenne, and M. Barahona. “Laplacian Dynamics and Multiscale Modular Structure in Networks.” IEEE Transactions on Network Science and Engineering 1, no. 2 (July 1, 2014): 76–90. https://doi.org/10.1109/TNSE.2015.2391998.
Lancichinetti, Andrea, and Santo Fortunato. “Community Detection Algorithms: A Comparative Analysis.” Physical Review E 80, no. 5 (November 30, 2009): 056117. https://doi.org/10.1103/PhysRevE.80.056117.
Metaxas, Panagiotis, Eni Mustafaraj, Kily Wong, Laura Zeng, Megan O’Keefe, and Samantha Finn. “What Do Retweets Indicate? Results from User Survey and Meta-Review of Research.” Proceedings of the International AAAI Conference on Web and Social Media 9, no. 1 (2015): 658–61.
Newman, M. E. J. “Modularity and Community Structure in Networks.” Proceedings of the National Academy of Sciences 103, no. 23 (June 6, 2006): 8577–82. https://doi.org/10.1073/pnas.0601602103.
Oliveira, Jaqueline Faria de, Humberto Torres Marques-Neto, and Márton Karsai. “Measuring the Effects of Repeated and Diversified Influence Mechanism for Information Adoption on Twitter.” Social Network Analysis and Mining 12, no. 1 (December 8, 2021): 16. https://doi.org/10.1007/s13278-021-00844-x.
Schoch, David, Franziska B. Keller, Sebastian Stier, and JungHwan Yang. “Coordination Patterns Reveal Online Political Astroturfing across the World.” Scientific Reports 12, no. 1 (March 17, 2022): 4572. https://doi.org/10.1038/s41598-022-08404-9.
Scott, John. Social Network Analysis. 1 Oliver’s Yard, 55 City Road London EC1Y 1SP: SAGE Publications Ltd, 2017. https://doi.org/10.4135/9781529716597.
Yang, Kai-Cheng, Francesco Pierri, Pik-Mai Hui, David Axelrod, Christopher Torres-Lugo, John Bryden, and Filippo Menczer. “The COVID-19 Infodemic: Twitter versus Facebook.” Big Data & Society 8, no. 1 (January 2021): 205395172110138. https://doi.org/10.1177/20539517211013861.
Yang, Song, Franziska B. Keller, and Lu Zheng. Social Network Analysis: Methods and Examples. SAGE Publications, 2016.